
Background
Output of Integrated Reaction Rates (IRR) is available in WRF-Chem from V4.0 and IRR can be analyzed with PERMM Analysis Tool. You can check the instruction on the UCAR website.
The steps of enabling IRR is written in detail but the PERMM document is too simple to follow.
This post is the part1 which focuses on the basic usage of PERMM for the official test data.
If you wanna learn the application for WRF-Chem, please check part2.
If you wanna define your own mechanism file, please check part3.
Installation
It’s better to install the latest version of PERMM from the official github repository.
I have fixed some bugs and improved it for WRF-Chem.
You can download it from my forked branch and install it from the directory:
python setup.py install
Note that it won’t remind you some necessary packages. You have to install them by yourself.
conda install -c conda-forge pseudonetcdf yaml
Reactions related to O3
I will focus on Ozone with the cb05_camx mechanism for the rest of this post.
The O3 has two natural sources:
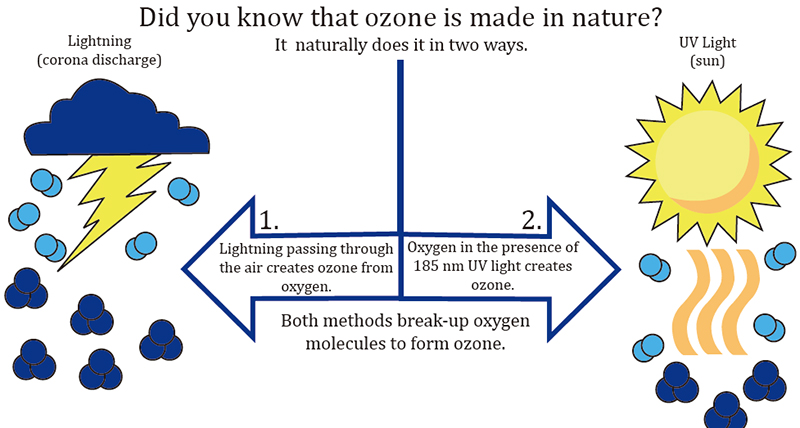
Actually, I’m interested in both of them! But the lightning one isn’t included in the WRF-Chem yet …
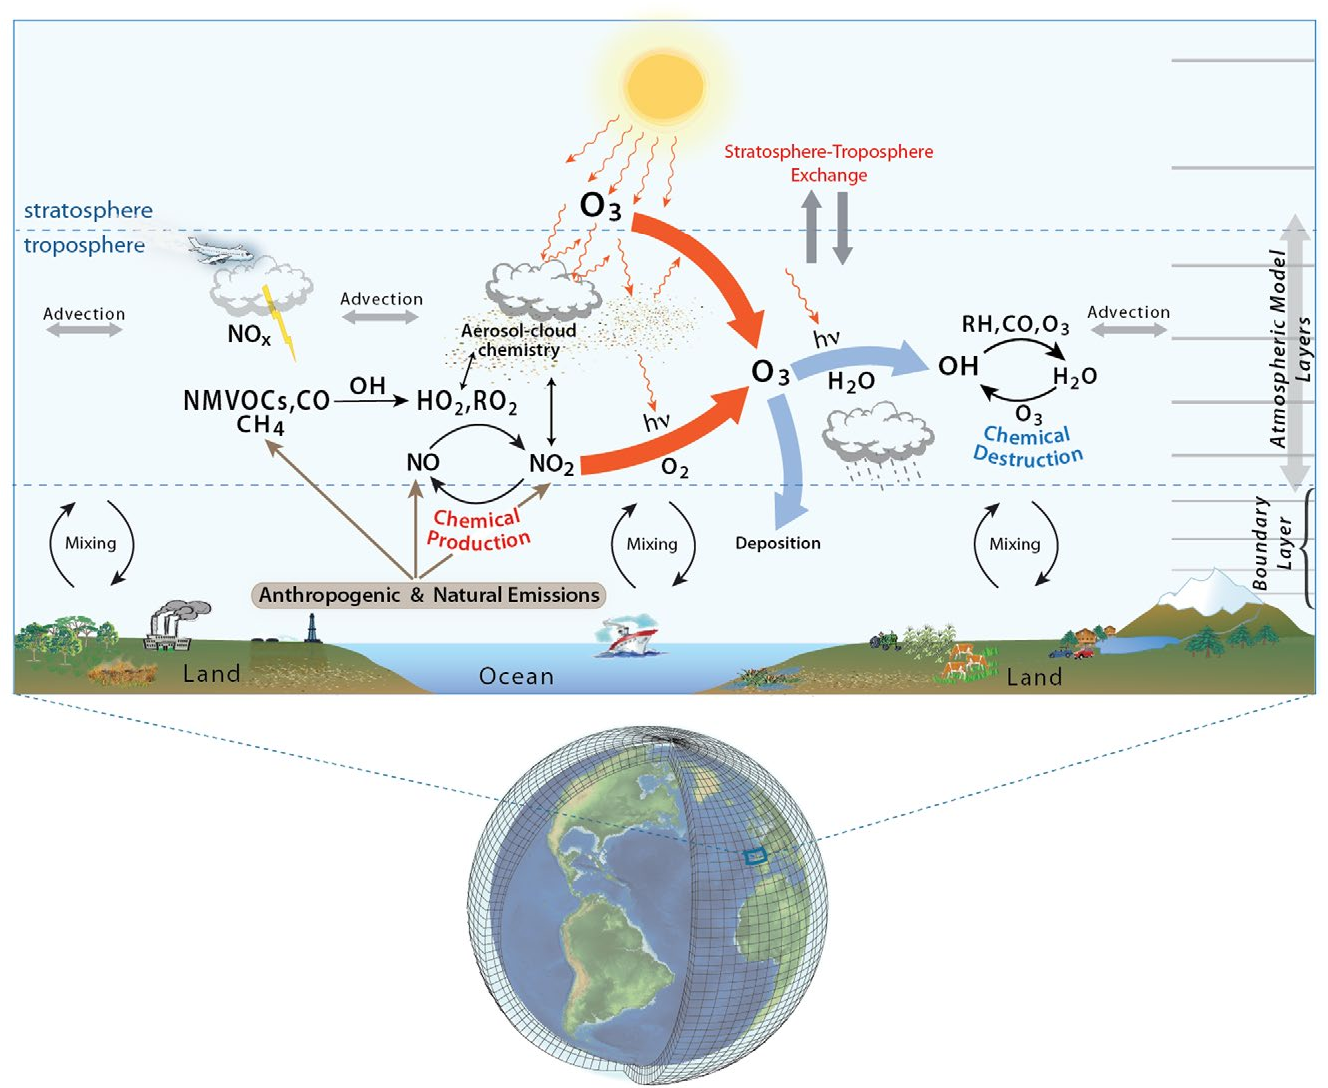
So, let’s talk about the photochemistry related to the O3. The illustration below clearly explain the main processes:
We can print the reactions producing O3 using the PERMM without the IRR files:
$ python -m permm -i --mechanism cb05_camx

#  all reaction names that create O3
>>> find_rxns(products=O3)
['RXN_02', 'RXN_108', 'RXN_92']

# all reaction names related to O3 (either as reactants or products)
>>> find_rxns(reactants=O3, products=O3, logical_and=False)
['RXN_02', 'RXN_03', 'RXN_07', 'RXN_08', 'RXN_09', 'RXN_108', 'RXN_12', 'RXN_121', 'RXN_125', 'RXN_129', 'RXN_13', 'RXN_140', 'RXN_146', 'RXN_150', 'RXN_155', 'RXN_49', 'RXN_92']

# print all reactions that create O3
>>> print_rxns(products=O3)
RXN_108 1.0*CXO3 + 1.0*HO2 ->[k] 0.8*PACD + 0.2*O3 + 0.2*AACD
RXN_92 1.0*C2O3 + 1.0*HO2 ->[k] 0.8*PACD + 0.2*O3 + 0.2*AACD
RXN_02 1.0*M + 1.0*O + 1.0*O2 ->[k] 1.0*O3 + 1.0*M

# print net reaction
>>> print_net_rxn(products=O3)
2*HO2 + 1*C2O3 + 1*CXO3 + 1*M + 1*O + 1*O2 ->[k] 1.6*PACD + 1.4*O3 + 1*M + 0.4*AACD
IRRs
Quickview
Let’s change the directory to the testdata directory (permm/src/permm/testdata) and use the example data.
$ python -m permm -i --mechanism cb05_camx test.mrg.nc

>>> plot_rxns(reactants = O3, products=O3, logical_and=False)
You will see this figure from the popup window:
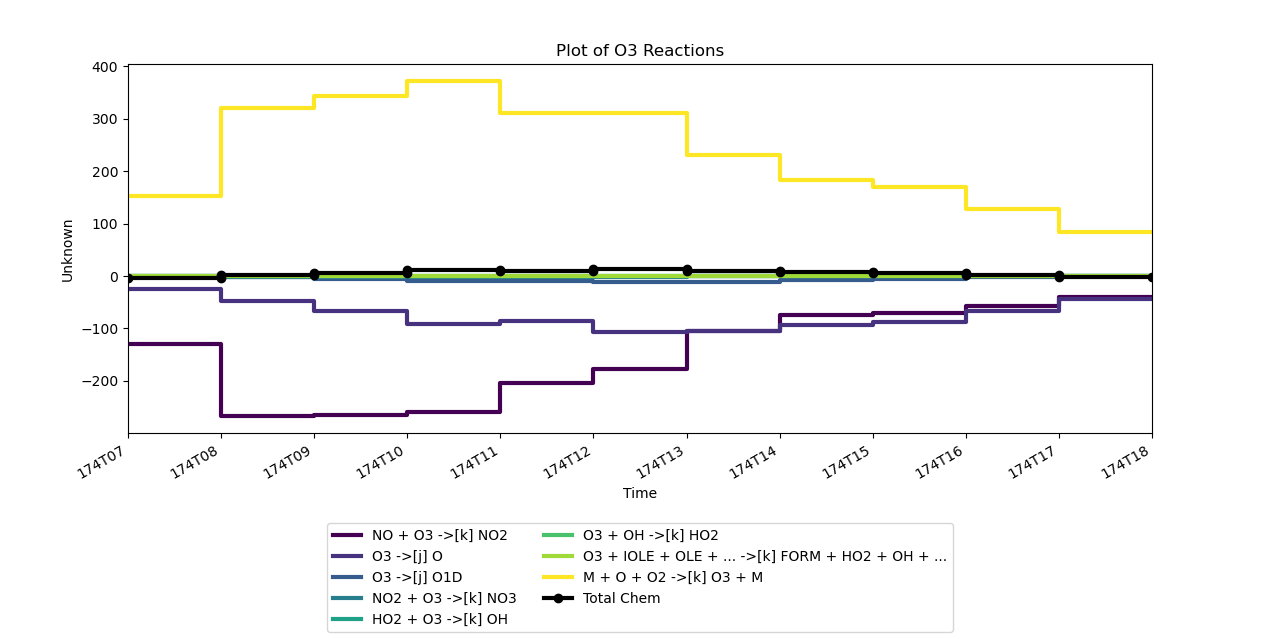
The quickview of the reactions can show us the overview, but we need to check the exact data and use it for our own plots.
Data structure
It’s easy to check the structure of the test file (test.mrg.nc).
>>> import xarray as xr

>>> ds = xr.open_dataset('./test.mrg.nc')

>>> ds
<xarray.Dataset>
Dimensions:  (COL: 26, DATE-TIME: 2, LAY: 20, PROCESS: 38, ROW: 12, RXN: 156, SPECIES: 21, TSTEP: 11, TSTEP_STAG: 25, VAR: 3)
Dimensions without coordinates: COL, DATE-TIME, LAY, PROCESS, ROW, RXN, SPECIES, TSTEP, TSTEP_STAG, VAR
Data variables:
    IPR      (TSTEP, SPECIES, PROCESS) float32 ...
    IRR      (TSTEP, RXN) float32 ...
    SHAPE    (TSTEP_STAG, LAY, ROW, COL) int32 ...
    TFLAG    (TSTEP, VAR, DATE-TIME) int32 ...
Attributes:
    irrfile:    camx451_cb05.20050623.hgb8h2.bc05jun.reg8_pscfv2.2005ep1_eta_...
    Reactions:  RXN_01          RXN_02          RXN_03          RXN_04       ...
    SDATE:      5174
    Process:    DIL             DDEP            DATE            AQACHEM      ...
    iprfile:    camx451_cb05.20050623.hgb8h2.bc05jun.reg8_pscfv2.2005ep1_eta_...
    STIME:      100.0
    Species:    H2O2            PAR             CO              OLE          ...
    TSTEP:      100.0
    history:    Tue Dec 30 14:16:42 2008: ncks -F -d TSTEP,8,18 test24.mrg.nc...
IRR is a variable of two dimensions (TSTEP, RXN) and the length of RXN is 156.
This is related to the reaction list defined in the yaml file.
Since it’s based on cb05_camx, let’s see the content of src/permm/mechanisms/cb05_camx.yaml:
---
comment: "Carbon Bond 05 (CB05) chemical mechanism as implemented in CAMx v4"
species_list:
    AACD: 2C + 1O + 1H
    ALD2: 2C + 1O + 4H
    .................
    .................

reaction_list:
    RXN_01: NO2 ->[j] NO + O
    RXN_02: O + O2 + M ->[k] O3 + M
    RXN_03: O3 + NO ->[k] NO2
    RXN_04: O + NO2 ->[k] NO
    .................
    .................

    RXN_154: TERP + OH ->[k] 0.75*HO2 + 1.25*XO2 + 0.25*XO2N + 0.28*FORM + 1.66*PAR + 0.47*ALDX
    RXN_155: TERP + O3 ->[k] 0.57*OH + 0.07*HO2 + 0.76*XO2 + 0.18*XO2N + 0.24*FORM + 0.001*CO + 7*PAR + 0.21*ALDX + 0.39*CXO3
    RXN_156: TERP + NO3 ->[k] 0.47*NO2 + 0.28*HO2 + 1.03*XO2 + 0.25*XO2N + 0.47*ALDX + 0.53*NTR

.................
So, ['RXN_02', 'RXN_108', 'RXN_92'] is the list of reaction names.
Unfortunately, the dimension of the test data doesn’t have coordinates …
Let create it by ourself for the simpler index later.
>>> reactions_name = find_rxns(reactants=O3, products=O3, logical_and=False)

>>> da = ds.assign_coords(RXN=['RXN_'+i.zfill(2) for i in ((ds.RXN)+1).values.astype('str')]).sel(RXN=reactions_name)

>>> da
<xarray.Dataset>
Dimensions:  (COL: 26, DATE-TIME: 2, LAY: 20, PROCESS: 38, ROW: 12, RXN: 17, SPECIES: 21, TSTEP: 11, TSTEP_STAG: 25, VAR: 3)
Coordinates:
  * RXN      (RXN) <U7 'RXN_02' 'RXN_03' 'RXN_07' ... 'RXN_49' 'RXN_92'
Dimensions without coordinates: COL, DATE-TIME, LAY, PROCESS, ROW, SPECIES, TSTEP, TSTEP_STAG, VAR
Data variables:
    IPR      (TSTEP, SPECIES, PROCESS) float32 ...
    IRR      (TSTEP, RXN) float32 ...
    SHAPE    (TSTEP_STAG, LAY, ROW, COL) int32 ...
    TFLAG    (TSTEP, VAR, DATE-TIME) int32 ...
Attributes:
    irrfile:    camx451_cb05.20050623.hgb8h2.bc05jun.reg8_pscfv2.2005ep1_eta_...
    Reactions:  RXN_01          RXN_02          RXN_03          RXN_04       ...
    SDATE:      5174
    Process:    DIL             DDEP            DATE            AQACHEM      ...
    iprfile:    camx451_cb05.20050623.hgb8h2.bc05jun.reg8_pscfv2.2005ep1_eta_...
    STIME:      100.0
    Species:    H2O2            PAR             CO              OLE          ...
    TSTEP:      100.0
    history:    Tue Dec 30 14:16:42 2008: ncks -F -d TSTEP,8,18 test24.mrg.nc...
Plot manually
The embedded plot function relies on the data structure strictly.
It’s better to plot all reactions by ourselves in case the structure of IRR files is different from the CAMX test data.
python -m permm --mechanism cb05_camx test.mrg.nc --scripts plot_irr.py
Here’s the content of the script called plot_irr.py:
import xarray as xr
import proplot as plot

# get the basic info of reactions
reaction_names = find_rxns(reactants=O3, products=O3, logical_and=False)
reaction_eqs = get_rxns(reactants=O3, products=O3, logical_and=False)
reaction_dict = dict(zip(reaction_names, [eq.display(digits = None) for eq in reaction_eqs]))
reactant_names = find_rxns(reactants=O3)

# read the reaction file
ds = xr.open_dataset('./test.mrg.nc')

# assign the coordinates for index
da = ds.assign_coords(RXN=['RXN_'+i.zfill(2) for i in ((ds.RXN)+1).values.astype('str')]).sel(RXN=reaction_names)['IRR']

# multiple the irr by net coefficient
coefficient = [eq['O3'].base.item() for eq in reaction_eqs]
da *= coefficient

# we only want to plot the large contributions
# so, sorting the integrated IRR by absolute vlalues and picking the 8 of them for plot
large_contrib = da.sum(dim='TSTEP').sortby(abs(da).sum(dim='TSTEP'), ascending=False).RXN[:8].values
irr_subset = da.sel(RXN=large_contrib)

# sort again for plot by real values
irr_subset = irr_subset.sortby(irr_subset.sum(dim='TSTEP'))

# generate labels based on RXN_**
labels = []
for rxn in irr_subset.RXN.values:
    labels.append(reaction_dict[rxn])

# plot
fig, axs = plot.subplots()
cmap = plot.Colormap('viridis')

lines = []
for i in range(irr_subset.sizes['RXN']):
    # "step": https://matplotlib.org/3.1.1/gallery/lines_bars_and_markers/step_demo.html#sphx-glr-gallery-lines-bars-and-markers-step-demo-py
    line = axs.step(irr_subset.TSTEP,
                    irr_subset.isel(RXN=i),
                    where='post',
                    label=labels[i],
                    color=cmap(i / (len(irr_subset.RXN)-1)),
                    )
    lines.append(line)

# plot the total IRR
total_line = axs.step(da.sum(dim='RXN'), where='post', label='Total Chem', color='k')
axs.format(title='Plot of O3 reactions', grid=False)
fig.legend(lines.append(total_line), loc='b', ncols=2)
fig.savefig('irr_o3.png')
The result shown below is as same as the former one created using the official plot function.
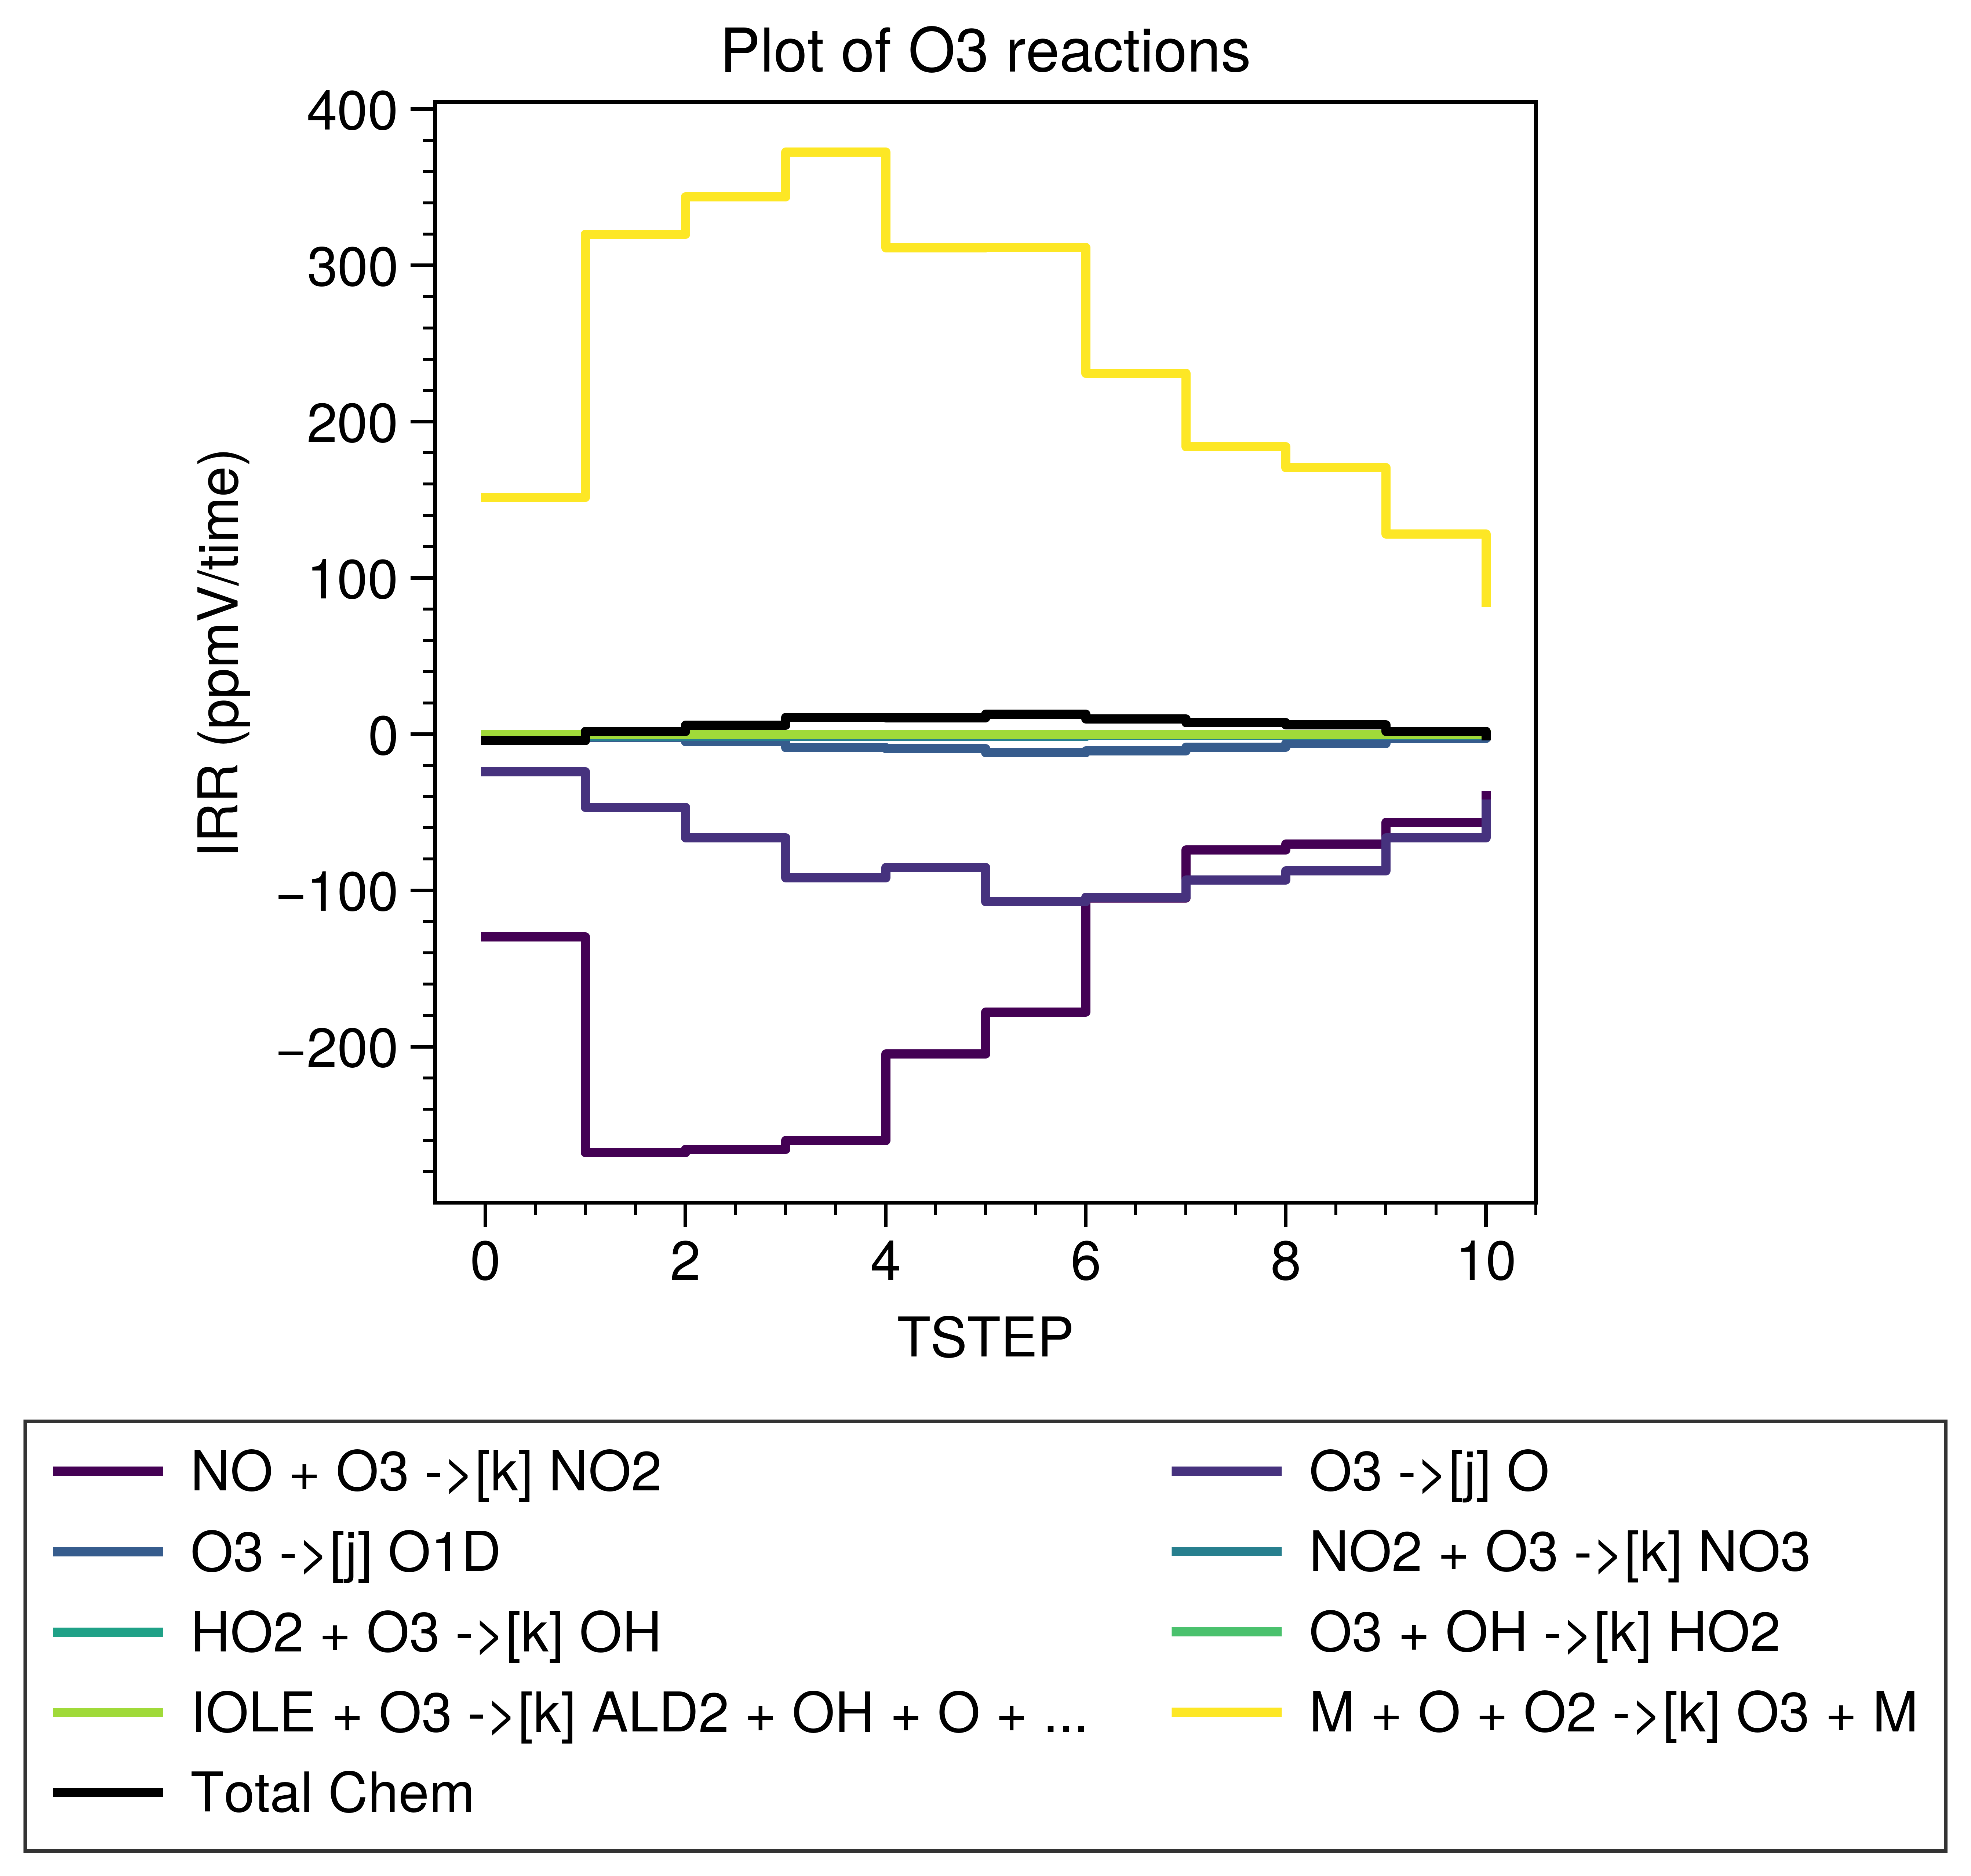
It’s better to make sure the total chem are correctly calculated.
The official time series of total chem of O3:
>>> make_net_rxn(reactants=O3, products=O3, logical_and=False)['O3']
Stoic([-4.075653   1.7998352  5.7559814 10.641052  10.435608  12.903931
  9.884674   7.516403   5.9432373  1.7922287 -1.0577393], role = 'u')
The calculated one:
<xarray.DataArray 'IRR' (TSTEP: 11)>
array([-4.0756407,  1.799851 ,  5.7559466, 10.641057 , 10.435598 ,
       12.90391  ,  9.884662 ,  7.5164156,  5.9432254,  1.7922215,
       -1.0577295], dtype=float32)
Dimensions without coordinates: TSTEP
It’s almost same … Maybe that’s the problem of float accuracy?
Actually, I have no experience of CAMX and can’t understand why the IRR value at each output time stands for the IRR between that time and the next one.
For WRF-Chem, IRRs are saved as integrated values. We need to calculate the difference and use pre instead of post in the step function.
Note that we can present the exact values in the terminal by print(irr_subset.to_series().to_string()) or print(irr_subset.to_series().to_markdown()) in markdown at the end of plot_irr.py to show the data.
Version control
| Version | Action | Time |
|---|---|---|
| 1.0 | Init | 2020-11-30 |
| 1.1 | Update plot function | 2020-12-01 |
| 1.2 | Update coefficients | 2020-12-02 |
Say something
Thank you
Your comment has been submitted and will be published once it has been approved.
OOPS!
Your comment has not been submitted. Please go back and try again. Thank You!
If this error persists, please open an issue by clicking here.