
Polygon of satellite swath
I found a similar question on stackoverflow. However, the author used the geojson file directly.
Luckily, TROPOMI L2 product includes the Geography Markup Language (GML) position named gml:posList attribute.
wikipedia:
The
<gml:posList>element is used to represent a list of coordinate tuples, as required for linear geometries:<gml:LineString gml:id="p21" srsName="http://www.opengis.net/def/crs/EPSG/0/4326"> <gml:posList srsDimension="2">45.67 88.56 55.56 89.44</gml:posList> </gml:LineString >
I found this answer using pygml to read the GML data. Note that we need to change the crs to WSG4326.
Then, we can generate the polygon easily (poslist is from the TROPOMI L2 file):
# generate geom
#   copy api from https://sentinelsat.readthedocs.io/en/v1.1.1/api_overview.html
geom = pygml.parse(f"""<gml:Polygon srsName="http://www.opengis.net/gml/srs/epsg.xml#4326" xmlns:gml="http://www.opengis.net/gml"><gml:exterior><gml:LinearRing><gml:posList>{poslist}</gml:posList></gml:LinearRing></gml:exterior></gml:Polygon>""")
Here’s an example
# get the polygon
polygon_swath = shape(geom.__geo_interface__)
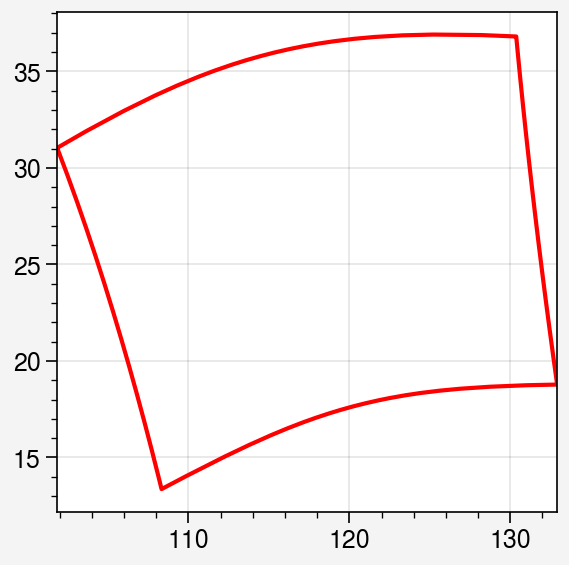
# plot swath boundary
x_swath, y_swath = polygon_swath.exterior.xy
plt.plot(x_swath, y_swath, c='r')
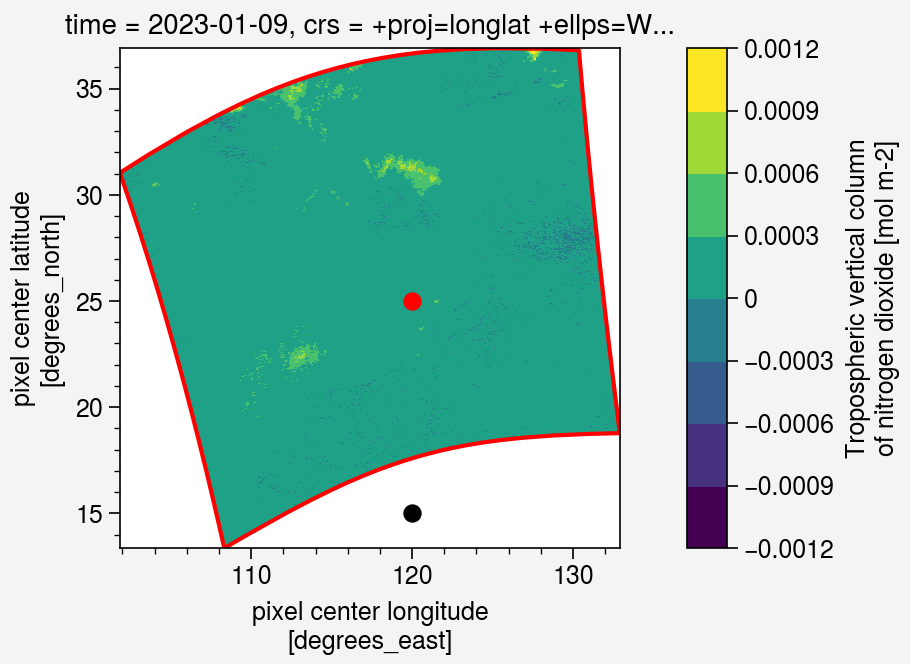
Points inside swath
Two cases
Here’s the full code of checking whether two points inside the TROPOMI swath.
import pygml
import numpy as np
import xarray as xr
import proplot as pplt
from satpy import Scene
from glob import glob
import pandas as pd
import geopandas as gpd
from shapely.geometry import shape, Point

# read poslist
metadata = 'METADATA/EOP_METADATA/om:featureOfInterest/eop:multiExtentOf/gml:surfaceMembers/gml:exterior'
f_tropomi = glob('/Users/xin/Documents/S5P_NRTI_L2__NO2____20230109T*')[0]
poslist = xr.open_dataset(f_tropomi, group=metadata).attrs['gml:posList']

# generate geom
#   copy api from https://sentinelsat.readthedocs.io/en/v1.1.1/api_overview.html
geom = pygml.parse(f"""<gml:Polygon srsName="http://www.opengis.net/gml/srs/epsg.xml#4326" xmlns:gml="http://www.opengis.net/gml"><gml:exterior><gml:LinearRing><gml:posList>{poslist}</gml:posList></gml:LinearRing></gml:exterior></gml:Polygon>""")

# get the polygon
polygon_swath = shape(geom.__geo_interface__)


# read tropomi data
scn = Scene([f_tropomi], reader='tropomi_l2')
scn.load(['nitrogendioxide_tropospheric_column'])

# --- plot ---
fig, axs = pplt.subplots()

# plot swath boundary
x_swath, y_swath = polygon_swath.exterior.xy
axs.plot(x_swath, y_swath, c='r')

# plot tropomi data
scn['nitrogendioxide_tropospheric_column'].plot(x='longitude', y='latitude', ax=axs, cmap='viridis')

# plot test points
point1 = Point(120, 25)
point2 = Point(120, 15)

for point in [point1, point2]:
    if polygon_swath.contains(point):
        color = 'r'
    else:
        color = 'k'
    axs.scatter(point.x, point.y, c=color)
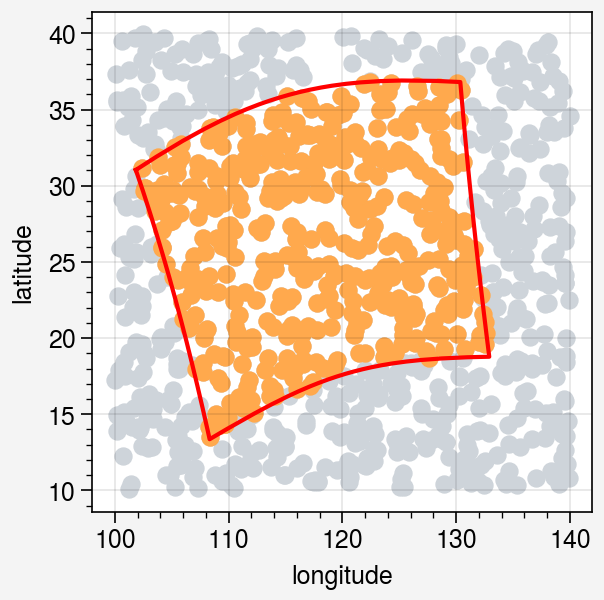
More cases
Let’s test the speed of checking multiple points.
def random_lat_lon(n=1, lat_min=-90., lat_max=90., lon_min=-180., lon_max=180.):
    """
    this code produces an array with pairs lat, lon
    """
    lat = np.random.uniform(lat_min, lat_max, n)
    lon = np.random.uniform(lon_min, lon_max, n)

    return np.array(tuple(zip(lon, lat)))

# create random points
random_points = random_lat_lon(1000, lat_min=10, lat_max=40, lon_min=100, lon_max=140)

df = pd.DataFrame({'longitude': random_points[:, 0], 'latitude': random_points[:, 1]})

points = gpd.GeoDataFrame(df, geometry=gpd.points_from_xy(df.longitude, df.latitude))
gdf_swath = gpd.GeoDataFrame(index=[0], geometry=[polygon_swath])

within_points = gpd.sjoin(points, gdf_swath, predicate = 'within')

# --- plot ---
fig, axs = pplt.subplots()

# plot swath boundary
x_swath, y_swath = polygon_swath.exterior.xy
axs.plot(x_swath, y_swath, c='r')

# plot data
axs.scatter(random_points[:, 0], random_points[:, 1], c='gray4')
axs.scatter(within_points['longitude'], within_points['latitude'], c='orange4')
Problem
If the swath cross 180 deg line or pole, this method won’t work. We need to split the GML into multi polygons.
For TROPOMI, we can download the wkt info from s5phub directly.
Version control
| Version | Action | Time |
|---|---|---|
| 1.0 | Init | 2023-01-10 |
Say something
Thank you
Your comment has been submitted and will be published once it has been approved.
OOPS!
Your comment has not been submitted. Please go back and try again. Thank You!
If this error persists, please open an issue by clicking here.